
White Label Client Reporting in Google Sheets for Agencies
Turn live form-sync sheets into branded, always-current client reports. The template structure, the branding layer, the rollout playbook, and the honest time math on reporting overhead.
In This Guide
- Why Agencies Are Moving Client Reports Into Google Sheets
- What Is White Label Client Reporting in Google Sheets?
- How Much Time Does Client Reporting Actually Cost?
- Manual Decks vs Reporting SaaS vs a Live Sheet
- How Should You Structure a Client Report Tab?
- How Do You Put Agency Branding on the Sheet Itself?
- Where Does a White-Label Add-On Fit?
- How Do You Roll This Out Across 20 Client Sites?
- Can the Live Sheet Improve Client Retention?
- Ship the First Live Report This Week
- Frequently Asked Questions
Why Agencies Are Moving Client Reports Into Google Sheets
White label client reporting in Google Sheets means each client gets a branded spreadsheet that updates itself the second a form fires on their site. The typical agency maintains 11-20 clients (AgencyAnalytics, 2024), and a Databox survey found 59% of agencies spend about an hour per client on reporting. A live sheet gives most of that hour back.
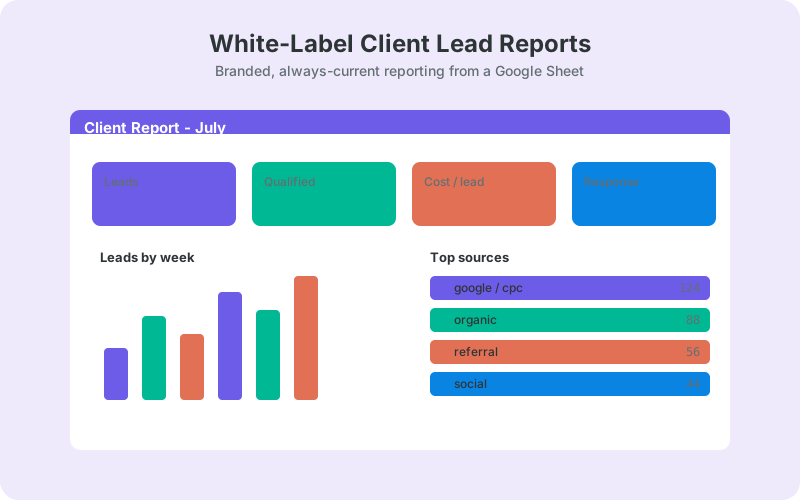
The mechanics are simple. Every form submission on a client site lands in a Google Sheet in real time, the sheet carries your agency's branding, and a report tab summarizes the numbers automatically. No monthly deck rebuild, no per-client dashboard subscription, no screenshots pasted into slides at 11pm before the review call.
This post covers the template structure, the branding layer, the rollout playbook, and the time math. It pairs with our agency client form reporting use case if you want the short version first.
What Is White Label Client Reporting in Google Sheets?
White label client reporting in Google Sheets is a setup where clients see your agency's brand at every touchpoint: the spreadsheet carries your logo, colors, and naming, and the WordPress plugin feeding it is rebranded to match. The client gets a live report; your agency gets the credit for the system behind it.
There are two layers to get right. The first is the sheet itself: a Google Sheet in your agency's Workspace account that receives every form submission from the client's site in real time, with a polished report tab on top. You control the file name, the cover tab, the sharing settings, and who can edit what.
The second layer is the plugin footprint. A white-label add-on replaces the sync plugin's name and branding inside the client's wp-admin, so an admin poking around sees your agency's toolkit rather than a third-party product they could go buy themselves. That distinction protects the perceived value of your retainer.
How Much Time Does Client Reporting Actually Cost?
More than most agencies budget. A Databox survey found 59% of agencies spend about one hour per client on reporting (Databox) - a directional figure, but a useful one. With most agencies maintaining 11-20 clients (AgencyAnalytics, 2024), that puts reporting at 11-20 hours every single month.
Run the math on the midpoint. Fifteen hours a month is 180 hours a year of non-billable production work: pulling numbers, pasting screenshots, fixing slide formatting, chasing the one metric that lives in a different tool. Multiply 180 by your blended hourly rate and you have the true annual cost of the monthly deck ritual.
A live sheet does not remove the strategic part of reporting - the commentary, the recommendations, the call. It removes the data collection and formatting, which is where most of that hour per client actually goes. The strategy time survives; the assembly time disappears.
Manual Decks vs Reporting SaaS vs a Live Sheet
Agencies deliver lead reports three ways: rebuild a deck by hand each month, pay a per-client fee for a hosted dashboard, or share a branded sheet that updates itself. The first costs hours, the second costs margin on every account, and the third costs a one-time template setup. The comparison table below breaks down how they differ for form-lead reporting.
The deck's real weakness is not the labor; it is staleness. By the time a monthly deck is delivered, its numbers are already weeks old, and any question the client asks means another manual pull. A live sheet answers follow-up questions by itself, because the client is looking at the same rows your team works from.
Reporting SaaS earns its fee when you report across ad platforms, analytics, and rank trackers in one view. For form leads - the number most clients care about first - a live sheet covers the job without per-seat pricing, and it doubles as the working lead list your team and the client already use.
How Should You Structure a Client Report Tab?
Use three tabs: a raw data tab that receives submissions untouched, a report tab with formulas that summarize it, and a branded cover tab clients land on first. Keeping raw data separate from presentation means the sync never breaks your formatting and your formulas never block the sync.
The raw tab fills itself with one row per submission. A column set that works for lead reporting:
- Timestamp - when the lead arrived
- Name, email, phone - the lead itself
- Form and page URL - which form converted, on which page
- _utm_source, _utm_medium, _utm_campaign - campaign attribution
- _gclid - the paid click ID for ad-spend tie-back
- Status - a manual column your team or the client updates
The report tab reads from the raw tab. A single =QUERY(Leads!A:J, "select E, count(A) where A is not null group by E order by count(A) desc", 1) gives leads by source, and a few COUNTIFS by month give the trend line. If a client wants charts on top, connect the same sheet to a Looker Studio dashboard without changing anything underneath.
How Do You Put Agency Branding on the Sheet Itself?
Brand the file, not just the plugin. The client opens this spreadsheet every week, so the sheet is the deliverable: your logo on the cover tab, your colors on the headers, your naming convention on the file, and sharing that comes from your agency's Google Workspace domain.
- Insert your logo on a cover tab with a short "how to read this report" note
- Apply brand colors to header rows and the report tab's summary blocks
- Name files consistently: "YourAgency - Lead Report - ClientName"
- Share view-only from your agency domain; grant comment access if the client wants to annotate
- Protect the raw and report ranges so a stray edit cannot break formulas
One more branding surface people forget: the email the share notification comes from. Sending from an agency Workspace account means the client's first touch with the report carries your domain, not a personal Gmail address.
View-only sharing matters more than it sounds. The report stays authoritative, and if you do grant edit access to a Status column, the version history in Sheets shows exactly who changed what and lets you roll back in two clicks.
Where Does a White-Label Add-On Fit?
The add-on handles the WordPress side of white labeling. SheetLink Forms syncs submissions from 12 major form plugins to Google Sheets in real time - one-click Google connect or a classic Apps Script receiver in your own Google account - and the white-label add-on rebrands that plugin footprint inside each client's wp-admin.
That means the settings screens a client admin sees carry your agency's name. Combined with sheets that live in your Workspace account, the entire reporting system reads as agency infrastructure. The agency tools documentation covers the rebranding options, and the agency guide walks through account structure for multi-client setups.
Because delivery goes straight from the client's WordPress site to Google rather than through a third-party processor, there is no per-task metering to absorb or pass on, and no external service in the data path that you would need to explain in a client contract or data-processing agreement.
How Do You Roll This Out Across 20 Client Sites?
Standardize once, then duplicate. Build one master template spreadsheet with the three-tab structure, one standard field map, and one branded cover. Every new client becomes a copy of the template plus a five-minute plugin connection, not a new reporting project.
- Create the master template with raw, report, and cover tabs
- Duplicate it per client and update the cover branding fields
- Install and connect the sync plugin on each client site with the same field map
- Send a test submission and confirm the row lands in seconds
- Share the view-only link in your onboarding email
The full multi-site process, including naming conventions and a master rollup across accounts, is in our agency playbook for form sync across 25 client sites. For clients standardized on Microsoft 365, the identical pattern works with real-time Excel reporting for agencies instead of Sheets.
Can the Live Sheet Improve Client Retention?
Yes, when you pair it with a short monthly email. Email marketing returns up to $36 per $1 spent, and agencies specifically see returns around 42:1 (Litmus). A three-paragraph monthly note that links the live sheet keeps your work visible between calls.
The format that works: one line on lead volume versus last month, one line on the best-performing source, one recommendation, then the sheet link. Five minutes to write, because the numbers are already computed on the report tab. Send it the same week each month so clients learn to expect it.
There is a subtler retention effect too. When the client's own team works out of the lead sheet daily - marking statuses, adding notes - your reporting artifact becomes their operational tool. Canceling the retainer would now mean losing a system they depend on, not just a vendor they evaluate.
Clients stop asking "what are we actually paying you for" when the answer is one bookmark away and current to the minute. The live report shifts the retention conversation from proving activity to discussing results.
Ship the First Live Report This Week
Pick your most report-hungry client and build their live sheet first. Copy the three-tab template, connect their forms, brand the cover, and send the view-only link with your next monthly note. One client is enough to prove the time savings before you roll it out portfolio-wide.
From there, duplicate across the roster and retire the deck rebuild. At 11-20 clients and roughly an hour of reporting each, the reclaimed time is the difference between reporting as overhead and reporting as a retention asset. Start with the agency tools docs and work through one site end to end.
| Manual monthly deck | Reporting SaaS | Live sheet report | |
|---|---|---|---|
| Data freshness | Weeks old at delivery | Refreshed daily | Real time |
| Cost per client | Hours of labor monthly | Per-client subscription | None after setup |
| Client access | Static PDF or slides | Hosted dashboard login | One always-current link |
| Branding | Rebuilt every month | Paid white-label tier | Your logo, colors, naming |
| Ongoing effort | Repeats monthly | Connector upkeep | Commentary only |
Frequently Asked Questions
What does white label client reporting in Google Sheets actually include?
Two layers: the spreadsheet the client sees carries your agency's logo, colors, and file naming, and a white-label add-on rebrands the sync plugin inside the client's WordPress admin. Together the client experiences a fully agency-branded reporting system with no third-party product names visible anywhere.
Do clients need a Google account to view the report?
Only if you restrict sharing to specific accounts. A view-only link set to "anyone with the link" opens without sign-in, which many agencies use. Restricted sharing is safer for lead data, though, so ask for a Google address at onboarding when you can.
How do I stop a client from breaking the report formulas?
Share view-only, or protect ranges if the client needs edit access. Sheets lets you lock the raw data tab and formula blocks while leaving a Status column editable. Version history also lets you restore any earlier state in a couple of clicks if something gets overwritten.
Is a live sheet better than a Looker Studio dashboard for clients?
They solve different problems. The sheet is the always-current data layer and stands alone for most lead reporting. Looker Studio adds polished charts on top and connects natively to Sheets, so start with the sheet and add a dashboard for clients who ask for visuals.
How many clients can I run from one Google account?
Each client gets their own spreadsheet, and a single Google Sheet holds up to 10 million cells (Google Drive Help), so account limits are rarely the constraint. Most agencies run one Workspace account with a folder per client and a strict naming convention.
What if a client's team lives in Excel instead of Google Sheets?
Mirror the same submissions to an Excel Online workbook in OneDrive. The report structure translates directly: raw table, report tab, branded cover. Our guide to real-time Excel reporting for agencies covers the setup for Microsoft-standardized clients.
Does the setup time really pay back?
Usually within the first month. A Databox survey found 59% of agencies spend about an hour per client on reporting, and the template-plus-duplicate rollout takes minutes per client after the first build. One skipped reporting cycle typically covers the entire setup effort.
More Automation guides
Give Every Client a Live, Branded Lead Report
SheetLink Forms syncs client form submissions to branded Google Sheets in real time - no Zapier tasks, no per-client reporting fees.