
Which WordPress Forms Convert Best? Find Out in Google Sheets
When every form on your site syncs to one Google Sheet with form IDs and UTM data, you can finally compare them - submissions per form, lead quality, placement, and honest conversion rates.
In This Guide
- Which of Your WordPress Forms Converts Best?
- Why Compare Forms in One Sheet?
- How Do You Get Every Form Into One Sheet?
- What Columns Does the Comparison Need?
- How Do You Count Submissions per Form?
- How Do You Compare Placement and Source?
- How Do You Calculate True Conversion Rates?
- How Do You Compare Lead Quality per Form?
- When Do You Kill or Iterate a Form?
- Turn the Comparison Into a Standing Dashboard
- Frequently Asked Questions
Which of Your WordPress Forms Converts Best?
Most site owners can't answer this, because each form plugin stores entries in its own database tables and nothing compares them. The average online form converts at just 1.7% per WPForms' research roundup, 2024 - and without unified data, you can't tell which of your forms drags that average down and which one quietly outperforms everything else.
The fix is structural, not analytical: sync every form on the site into one Google Sheet with a form-ID column and UTM metadata on every row. Once submissions share a spreadsheet and a column layout, comparing forms becomes COUNTIF arithmetic instead of guesswork across three plugin dashboards that don't speak to each other.
This guide covers the sheet setup, the counting recipes, placement and source comparisons, lead-quality scoring per form, kill-or-iterate decision rules, and the honest caveat most tutorials skip: true conversion rates need page-view denominators from your analytics tool, not just submission counts.
Why Compare Forms in One Sheet?
Because fragmented data quietly kills attribution. In a 2025 survey of 750 marketing leaders, only 18% said they were very confident in their conversion attribution (Branch via MediaPost, 2025). When your contact form, quote form, and newsletter signup live in three separate plugin databases, you're structurally guaranteed a seat with the unconfident 82%.
A single submissions sheet changes the questions you can ask. Which form produces the most leads is table stakes. The interesting questions are which placement converts the visitors it actually receives, which traffic source sends leads that score well, and which forms deserve to die. Every one of those needs all submissions in one table with consistent columns.
There's a durability argument too: plugin entry tables get pruned, plugins get swapped, and sites get rebuilt. A spreadsheet outlives all of that, so your comparison history survives the next redesign intact.
How Do You Get Every Form Into One Sheet?
SheetLink Forms syncs all 12 major form plugins - Contact Form 7, WPForms, Gravity Forms, Elementor Pro, Fluent Forms, and more - to Google Sheets in real time, so mixed form stacks on one site can share a single Submissions tab. Connect with one-click Google Sheets connect (pick or create the sheet in the Google file picker) or through a classic Google Apps Script receiver in your own Google account - no Zapier and no per-task fees either way.
Two setup decisions make the comparison possible. First, point every form's rule at the same spreadsheet and tab so rows interleave chronologically. Second, stamp a form identifier into every row: the simplest route is a hidden field with a fixed value (quote-form, footer-contact, popup-newsletter) mapped to a form_id column. Page URL metadata is captured automatically and works as a fallback dimension when forms live on distinct pages.
UTM parameters like _utm_source and _utm_medium are appended automatically as well - our UTM tracking guide shows what that unlocks. If you'd rather keep raw streams separate, the form integrations docs cover per-form tabs; you can still compare across tabs with QUERY, but one shared tab keeps every recipe below simpler.
What Columns Does the Comparison Need?
Seven columns power every recipe in this post: timestamp, form_id, page URL, utm_source, utm_medium, utm_campaign, and email. Add a lead-score column if you plan to grade quality, and a replied or outcome column if you track what happened after the submission - both pay for themselves within a month.
Timestamp, page URL, and UTM values arrive as automatic metadata; form_id comes from the hidden field described above. Email matters for honesty as much as follow-up: double submissions inflate a form's apparent performance, so counting unique addresses per form is often a truer measure than counting raw rows.
Resist adding twenty more columns. Every formula below runs on this narrow set, narrow sheets stay fast as history accumulates, and each extra form field costs you conversions anyway - a point the abandonment data later in this post makes painfully well.
How Do You Count Submissions per Form?
COUNTIF does the baseline: =COUNTIF(Submissions!B:B, "quote-form") counts all-time submissions for one form, with form_id in column B. Add a date window with COUNTIFS: =COUNTIFS(Submissions!B:B, "quote-form", Submissions!A:A, ">="&TODAY()-30) gives the last 30 days.
For the whole table at once, QUERY beats a stack of copy-pasted COUNTIFs:
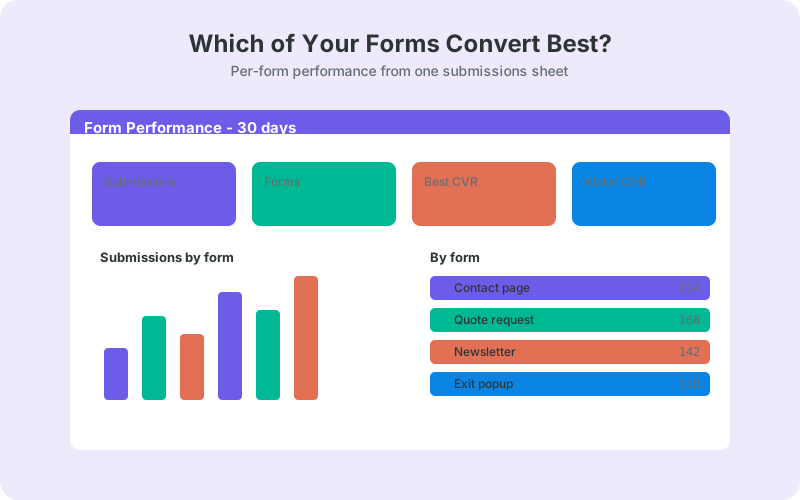
- Submissions by form:
=QUERY(Submissions!A:G, "select B, count(A) group by B order by count(A) desc", 1) - Unique leads per form:
=COUNTUNIQUEIFS(Submissions!G:G, Submissions!B:B, "quote-form")with email in column G, which strips double submissions from the count - This month by form: add
where A >= date '2026-08-01'to the QUERY clause
The QUERY function guide for lead reports covers the clause syntax if it's new to you. Ten minutes of formula work produces a live leaderboard that no individual plugin dashboard can offer, because no plugin sees the other plugins' forms.
How Do You Compare Placement and Source?
The same form can perform wildly differently by placement and traffic source, and the page URL plus UTM columns expose both. Group by page to see placement: =QUERY(Submissions!A:G, "select C, count(A) group by C order by count(A) desc", 1) with page URL in column C shows exactly which pages produce leads and which just host a form.
Cross form against source with a pivot-style QUERY: =QUERY(Submissions!A:G, "select B, count(A) group by B pivot D", 1) puts forms in rows and utm_source values in columns. One glance can show that the quote form lives almost entirely on paid traffic while the newsletter form only ever converts organic readers - which changes where you spend next month's budget.
Read placement numbers with care, though. A footer form that appears on every page will out-count a form on one landing page without being better at its job. That's a volume artifact of exposure, which is exactly why the next section exists.
How Do You Calculate True Conversion Rates?
Honestly: not from the sheet alone. Submission counts are numerators; a conversion rate needs page views of each form's host page as the denominator, and those live in your analytics tool, not the spreadsheet. Any comparison that skips this step systematically rewards forms on high-traffic pages rather than forms that convert well.
The practical workflow is a small Pageviews tab: one row per form, with monthly views for its hosting page pasted from GA4 or whatever analytics you run, once a month. Then the rate is plain division: =COUNTIFS(Submissions!B:B, "quote-form", Submissions!A:A, ">="&DATE(2026,8,1))/Pageviews!B2. Five minutes of manual pasting per month buys you honest numbers all year.
Benchmark against the 1.7% cross-industry average form conversion rate reported in WPForms' research roundup, 2024, but treat your own forms as each other's real benchmark. A 4% form and a 0.5% form sitting on comparable traffic is a finding you can act on; either number alone is trivia.
How Do You Compare Lead Quality per Form?
Submission counts crown the wrong winners whenever one form attracts tire-kickers. Pair the volume comparison with a lead score - built from budget, timeline, message length, business email versus free email - computed in a helper column, then average it per form: =AVERAGEIF(Submissions!B:B, "quote-form", Submissions!H:H) with the score in column H.
Our no-AI lead scoring formula builds that score with plain spreadsheet functions. Once it exists, ranking forms by average score makes the volume-versus-quality tension visible: the popup might win on count while the detailed quote form wins on score by a factor of three. Those two forms have different jobs, and now you can prove it.
Quality data also feeds operations directly. With conditional routing, high-intent forms can write to a priority tab your sales side watches while low-intent forms flow to a nurture tab - so the comparison and the daily workflow run on the same signal.
When Do You Kill or Iterate a Form?
Review the leaderboard monthly and act on three signals. Low volume plus low quality after a fair traffic sample: kill the form or its placement. Decent traffic but weak conversion: iterate, starting with length - cutting a form from four fields to three lifted conversion roughly 50% in a test cited by WPForms' roundup, 2024. High volume but low score: tighten the qualifying fields and accept fewer, better leads.
Abandonment is the invisible column in your sheet. About a third of people who start filling out a form quit mid-way, per the same roundup, and your spreadsheet only records finishers. A form with respectable submission counts can still be hemorrhaging starters, which is why shortening tends to outperform redesigning.
When two variants compete for the same job, run them side by side with distinct form_id values and let the sheet keep score. The A/B testing guide for WordPress forms covers a clean split without any extra testing tools.
Turn the Comparison Into a Standing Dashboard
Once the recipes work, promote them to a Dashboard tab: submissions by form this month, average score by form, the source pivot, and the conversion column fed by your monthly page-view paste. Add sparklines next to each form for trend at a glance, and the monthly form review becomes a five-minute scan instead of an afternoon of exports.
Our guide to Google Sheets dashboards for lead data covers the charts, sparklines, and pivot patterns on exactly this kind of submissions table. The hard part was never the formulas - it was getting every form's data into one place with a form_id on every row. Solve that once, and the answer to "which forms convert best" refreshes itself every time a visitor hits submit.
Frequently Asked Questions
Can I compare forms from different plugins in one Google Sheet?
Yes, if each form syncs to the same spreadsheet tab with a shared column layout and a form_id value per row. Plugin dashboards can't compare across products, but a unified sheet makes cross-plugin comparison a COUNTIF away, whether the forms are Contact Form 7, WPForms, or Elementor.
What is a good form conversion rate?
The cross-industry average is about 1.7% per WPForms' research roundup, 2024, but rates vary widely by industry, traffic quality, and offer. Your own forms are the better benchmark: compare each against your site's median and investigate outliers in both directions.
How do I count submissions per form in Google Sheets?
Use =COUNTIF(B:B, "form-id") with your form_id column in B, or COUNTIFS to add a date window. For all forms at once, a QUERY with group by produces a live leaderboard: select B, count(A) group by B order by count(A) desc.
Can Google Sheets calculate conversion rates on its own?
No. The sheet holds submissions, which are only the numerator. A conversion rate needs page views of each form's host page as the denominator, and those come from GA4 or another analytics tool. Paste monthly view counts into a small tab and divide - raw submission counts alone reward high-traffic pages.
How do I see which traffic source sends the best leads?
Combine the auto-captured UTM columns with a lead score, then average the score by source: =AVERAGEIF(D:D, "google", H:H). A pivot-style QUERY crossing form_id against utm_source shows volume, while the score average shows quality. You want both before shifting any ad budget.
Should I delete a form that gets few submissions?
Not on volume alone. Check its average lead score and its placement traffic first: a low-volume form on a low-traffic page may convert its visitors well and deserve better placement rather than deletion. Kill forms that fail on both volume and quality after a fair traffic sample.
Does form length really affect conversion?
Yes, measurably. Cutting a form from four fields to three lifted conversions by roughly 50% in a test cited in WPForms' roundup, 2024, and 27% of abandoners in the same roundup blame forms being too long. Trim to the fields you genuinely use.
Do I need an A/B testing plugin to compare form variants?
No. Publish two variants with distinct form_id values, split placement or traffic between them, and let the submissions sheet keep score with the same COUNTIF recipes. Our A/B testing guide covers a clean setup, including denominators when variants sit on different pages.
More Lead Management guides
Compare every form in one Google Sheet today
SheetLink Forms syncs 12 major form plugins to one sheet in real time - no Zapier tasks, no monthly automation fees.