
Build an Event Registration Tracker in Google Sheets
Turn a WordPress registration form into a live attendee sheet: capacity countdown formulas, dietary and accessibility columns, a check-in list for event day, and UTM columns that show which channel filled the room.
In This Guide
- Why Track Event Registrations in Google Sheets?
- What Columns Does an Event Registration Sheet Need?
- How Do You Connect Your Registration Form to the Sheet?
- How Do You Build a Capacity Countdown Formula?
- Dietary and Accessibility Columns That Save Event Day
- How Many No-Shows Should You Plan For?
- The Check-In Column: Your Sheet as the Door List
- Which Channel Actually Filled the Room? UTM Columns
- What Happens After the Event?
- Next Step: Build the Tracker Before You Need It
- Frequently Asked Questions
Why Track Event Registrations in Google Sheets?
An event registration tracker in Google Sheets turns WordPress form submissions into a live attendee list with a seat countdown, dietary columns, and a check-in view for the day itself. You need one because registrations are not attendees: the average webinar show-up rate was 47.7% in 2025 (Livestorm, 2026).
Most event teams learn that gap the hard way. Signups climb, catering gets ordered for every name on the list, and the room ends up a third empty. A spreadsheet will not force people to show up, but it lets you plan around the ones who do not, and it costs nothing.
This guide covers the full build: the columns worth capturing, a capacity countdown formula, dietary and accessibility fields, a sensible overbooking buffer, a check-in column for the door, and UTM columns that reveal which marketing channel actually filled the room.
What Columns Does an Event Registration Sheet Need?
A useful event registration sheet needs three groups of columns: identity (name, email, phone), logistics (ticket type, party size, dietary needs, accessibility requests), and operations (timestamp, status, source, checked in). Livestorm's benchmark of 33,786 sessions puts the average webinar at 175 registrants (Livestorm, 2026), which is far too many rows to manage from an email inbox.
- Timestamp - when the registration arrived, filled automatically
- Name and email - your join instructions and follow-up list
- Ticket type or session - essential if you run more than one
- Party size - one registration can mean three seats
- Dietary and accessibility - structured options, covered below
- Status - Confirmed, Waitlist, or Cancelled
- Checked in - a checkbox you tick at the door
- UTM source and campaign - which channel sent them
Keep one row per registration and never delete rows. A cancellation becomes a status change, not a deletion, so your counts stay honest and your post-event analysis still works. If your events involve time slots rather than one big date, the same structure powers appointment tracking too - see our guide to booking forms in Google Sheets.
How Do You Connect Your Registration Form to the Sheet?
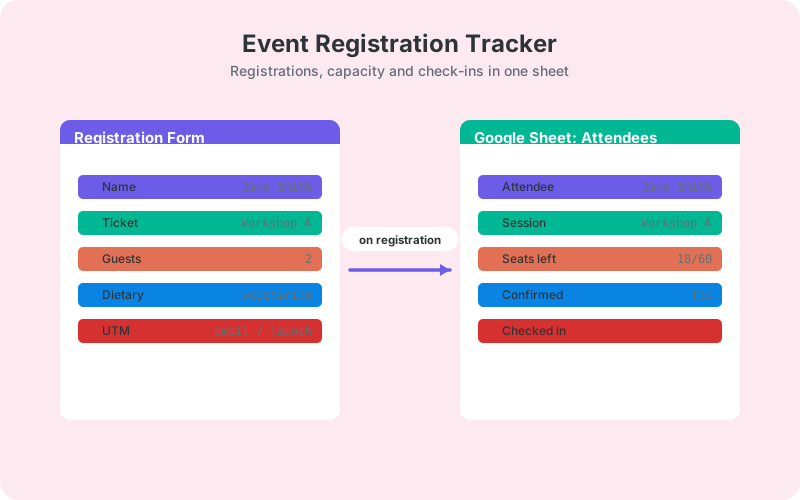
The reliable way to fill this sheet is a direct connection from your WordPress form. SheetLink Forms sends every submission to Google Sheets in real time - no Zapier, no per-task fees, and no third-party service holding your attendee list. Connect with one click, or use the classic self-hosted Apps Script receiver.
- Install the free SheetLink Forms plugin from WordPress.org.
- Connect Google Sheets: click Connect Google and pick your sheet in the Google file picker (about a minute, no Google API keys), or deploy the classic Apps Script receiver following the Google Sheets setup guide - the OAuth-free, fully self-hosted option.
- Map your form fields to the columns from the previous section.
- Submit a test registration and watch the row appear.
The free core supports 12 major form plugins, including Contact Form 7, WPForms, Gravity Forms, Elementor Pro, and Fluent Forms, so whatever registration form you already run almost certainly works. An automatic retry queue with exponential backoff re-delivers any submission that fails on the first attempt, which matters when a launch email spikes your traffic and the last thing you want is a missing registrant at the door.
How Do You Build a Capacity Countdown Formula?
A capacity countdown is one formula: subtract confirmed seats from your total and floor the result at zero. With status in column F, party size in column E, and 120 seats, =MAX(0, 120 - SUMIF(F2:F, "Confirmed", E2:E)) shows exactly how many seats remain, updating the moment each registration lands.
If every registration is one seat, the simpler =MAX(0, 120 - COUNTIF(F2:F, "Confirmed")) does the job. Put the formula in a frozen header cell so it stays visible while you scroll, and label it clearly - this one number drives your promotion decisions for the final week.
Two refinements earn their keep. Wrap the countdown in an IF so it displays "Waitlist only" when it hits zero, and add a conditional formatting rule that turns the cell red below ten seats. These building blocks - COUNTIF, SUMIF, and friends - appear in every tracker you will ever build; our roundup of Google Sheets formulas every lead sheet needs covers the rest of the family.
Dietary and Accessibility Columns That Save Event Day
Collect dietary and accessibility needs as structured options, not free text. A dropdown with Vegetarian, Vegan, Gluten-free, Halal, Kosher, Allergy (see notes), and None means a single COUNTIF per option turns the column straight into a catering order. Free text produces twelve spellings of "gluten free" and a manual counting job the night before.
Pair the dropdown with an optional free-text notes field for specifics like nut allergies. Handle accessibility the same way: a dropdown for common requests (step-free access, hearing loop, reserved seating, other) plus a notes field. Ask on the registration form itself - chasing these answers by email afterwards gets patchy responses and last-minute surprises.
One caution: dietary and accessibility answers can reveal health or religious information. Restrict sheet sharing to the people who genuinely need it, and archive or delete those columns once the event is done rather than letting them sit in a widely shared file forever.
How Many No-Shows Should You Plan For?
Plan for a meaningful share of registrants to stay home. Across 33,786 webinars, the average show-up rate was 47.7% in 2025 - the typical session drew 175 registrants and roughly 83 live attendees (Livestorm, 2026). In-person events fare better: industry aggregates put attendance near 68% of registrants (Nunify).
For a free in-person event, those aggregates suggest a starting buffer of roughly 30 to 50 percent more registrations than seats. Treat that as a first-event hypothesis, not a rule. Paid tickets, reminder emails, and audience type all move the number, and overfilling a room with fire-code limits carries real risk - so buffer your catering and your promotion, and keep hard seating capacity sacred.
This is exactly why the check-in column earns its place. After one event, =COUNTIF(H2:H, TRUE) / COUNTIF(F2:F, "Confirmed") gives you your own show-up rate, and every event after that gets planned on your data instead of anyone else's benchmark.
The Check-In Column: Your Sheet as the Door List
On event day, the registration sheet becomes the door list. Insert a checkbox column (Insert, then Tick box in Google Sheets), sort rows by last name, and anyone with the sheet open on a phone or tablet can check guests in with one tap - no badge scanner, no printed list going stale.
Create a filter view for the door team that hides everything except name, party size, ticket type, and the checkbox. Filter views do not disturb anyone else using the sheet, so two volunteers can work the door from their phones while the organizer watches totals from a laptop backstage.
Add a live counter in the header: =COUNTIF(H2:H, TRUE) checked in so far, next to your confirmed total. Walk-ins get a new row typed in on the spot with status Confirmed and the box ticked, which keeps your attendance math correct when you review the numbers the next morning.
Which Channel Actually Filled the Room? UTM Columns
UTM columns answer the question your next event budget depends on: which channel filled the room? Tag every registration link with utm_source and utm_campaign, capture those values alongside each submission, and a small pivot table shows registrations - and, more importantly, checked-in attendees - per channel.
Capture is automatic if your form connection appends UTM data. SheetLink Forms adds _utm_source, _utm_campaign, and click IDs like _gclid to each row without any extra fields on the form itself. The setup, plus the naming conventions that keep your pivot tables clean, is covered in our guide to UTM tracking for WordPress forms.
The check-in cross-reference is the real payoff. A channel that drives plenty of registrations but few actual attendees is inflating your catering bill, not your event. Judging channels on attendance instead of signups is only possible when both live in the same sheet, which is the quiet advantage of this whole setup.
What Happens After the Event?
After the event, the tracker becomes a follow-up engine. Filter checked-in guests for the thank-you email and the slides. Send no-shows the recording with a lighter touch and an invitation to the next date. For many events the no-show segment is the biggest list you have, so writing it off wastes most of your registration effort.
If you run events regularly, repeat registrants accumulate fast. Deduplicating by email keeps your mailing list clean and surfaces your regulars - the people most likely to speak, volunteer, or buy. Our guide to deduplicating leads in Google Sheets covers the formulas.
Finally, keep stakeholders out of the sheet itself. A scheduled summary email with new registration counts and the capacity countdown answers "how are signups going?" before anyone asks - see scheduling weekly digests from Google Sheets for the pattern.
Next Step: Build the Tracker Before You Need It
Build the tracker before registrations start, not after they pile up in an inbox. The full setup is an afternoon: connect the form, add the status and checkbox columns, drop in the countdown formula, and tag your promotion links with UTMs.
Every event after the first gets easier, because you will plan with your own show-up rate, your own channel data, and a clean list of past attendees instead of industry averages. For the broader pattern of running any inbound list through a spreadsheet, see tracking leads in Google Sheets - then start with your very next event.
Frequently Asked Questions
What percentage of event registrants actually show up?
For webinars, the 2025 average show-up rate was 47.7%, based on Livestorm's analysis of 33,786 sessions. In-person events tend to do better, with industry aggregates around 68% of registrants attending. Your own rate depends on price, reminders, and audience, which is why tracking check-ins in your sheet matters.
Should I overbook a free event?
A buffer of roughly 30 to 50 percent more registrations than seats is a reasonable starting point for free in-person events, given industry attendance aggregates near 68%. Treat it as a hypothesis: let your first event's check-in data set the next buffer, and never exceed venue safety limits.
How do I count remaining seats automatically in Google Sheets?
Subtract confirmed registrations from capacity and floor at zero: =MAX(0, 120 - COUNTIF(F2:F, "Confirmed")) for 120 seats with status in column F. If one registration can cover several seats, use SUMIF over a party-size column instead. Put the formula in a frozen header cell so it stays visible.
Can I use Google Sheets as a check-in list on event day?
Yes. Add a checkbox column, sort by last name, and check guests in from any phone or tablet with the sheet open. A filter view showing only name, party size, and the checkbox keeps the door team fast without disturbing anyone else working in the same sheet.
How do I collect dietary requirements on a registration form?
Use a dropdown with fixed options (Vegetarian, Vegan, Gluten-free, Halal, Kosher, Allergy, None) plus an optional notes field, rather than free text. Structured options mean one COUNTIF per choice turns the column into a catering order, and nothing gets lost to creative spelling.
How do I know which marketing channel drove the most attendees?
Tag registration links with utm_source and utm_campaign, capture those values in the sheet with each submission, then pivot checked-in attendees by source after the event. Comparing attendance rather than raw signups per channel shows which promotion actually filled the room, not just the list.
Does SheetLink Forms work with my registration form plugin?
The free core supports 12 major form plugins, including Contact Form 7, WPForms, Gravity Forms, Elementor Pro, Fluent Forms, and Ninja Forms. Submissions arrive in your Google Sheet in real time, and an automatic retry queue re-delivers anything that fails during a traffic spike.
What should I do about no-shows after the event?
Keep them. Send the recording or a recap with an invitation to the next date, and leave their rows in the sheet with the check-in box unticked. No-shows registered interest once and often attend later, so they are usually your largest and cheapest audience for the next event.
More Lead Management guides
Send registrations straight to your sheet
Deliver WordPress event registrations to Google Sheets in real time - no Zapier, no per-task fees, no middleware.