
LearnDash Enrollments to Google Sheets: Course Ops Register
Enrollments, completions, and quiz outcomes land in one course register automatically. From there: instructor dashboards, cohort completion rates, and weekly summaries your team will actually read.
In This Guide
- A Course Ops Register in Google Sheets
- Why Put Course Data in a Spreadsheet?
- Which LearnDash Events Should You Capture?
- How Does LearnDash Data Reach the Sheet?
- Setting Up the LearnDash Add-On
- What Goes on an Instructor Dashboard Tab?
- How Do You Track Cohort Completion?
- Quiz Outcomes, Segmentation, and Follow-Up
- How Do the Numbers Reach Your Inbox?
- Start With Enrollments, Then Widen
- Frequently Asked Questions
A Course Ops Register in Google Sheets
You can keep a live course operations register in Google Sheets: every LearnDash enrollment, course completion, and quiz result appended as a row the moment it happens. LearnDash reports 100,000+ active installs and more than 25 million learners (MemberPress, 2026), yet the day-to-day questions - who enrolled this week, who finished, who failed the quiz twice - are spreadsheet questions.
This guide wires up the register, then puts it to work: an instructor dashboard tab that non-admins can actually use, cohort completion tracking built from a couple of COUNTIFS formulas, and quiz-outcome patterns that feed segmentation and follow-up. Everything runs on your site and your own Google account, with no middleware in between.
Why Put Course Data in a Spreadsheet?
Because it is the one reporting surface everyone involved already knows. Google Workspace has over 3 billion users (Google, 2026), which in practice means your co-instructor, your client, and your virtual assistant can all read - and extend - a Sheets register without training, licenses, or another login to manage.
LearnDash's built-in reporting answers predefined questions. A register answers emergent ones: which lesson do people stall on before abandoning, do learners from one cohort finish faster than another, does repeated quiz failure predict refund requests. Those are joins and filters, and a spreadsheet does joins and filters all day.
There is an access-control benefit too. Instructors and stakeholders rarely need wp-admin; they need the numbers. A shared spreadsheet, or a separate dashboard file fed from the register, gives them exactly that with none of the risk of handing out WordPress accounts on a production site.
Which LearnDash Events Should You Capture?
Three event streams cover course operations: enrollments, completions, and quiz attempts. Log each as its own row with an event-type column, and the register becomes a timeline of learner activity you can slice any way you like - by course, by cohort, by week, by learner.
- Enrollment - learner email, course, date, and the cohort or traffic source if you have it
- Completion - course-level at minimum, lesson-level if volume allows; the completion date enables time-to-complete math later
- Quiz attempt - quiz name, score, pass or fail, and attempt number, since attempt number is what separates struggling learners from careless ones
Log completions as their own rows, not as a status update on the enrollment row. A separate completion event preserves both dates, which is what makes time-to-complete and cohort math possible later, and it means an enrollment row is never edited after it is written. Updating in place feels tidier, but it destroys the one thing the register exists to protect: the order in which things happened.
Add a cohort column from day one, even if it is just the enrollment month. Cohorts are the difference between knowing your overall completion rate and knowing it dropped for everyone who joined after you rewrote module two - only the second fact tells you what to fix.
How Does LearnDash Data Reach the Sheet?
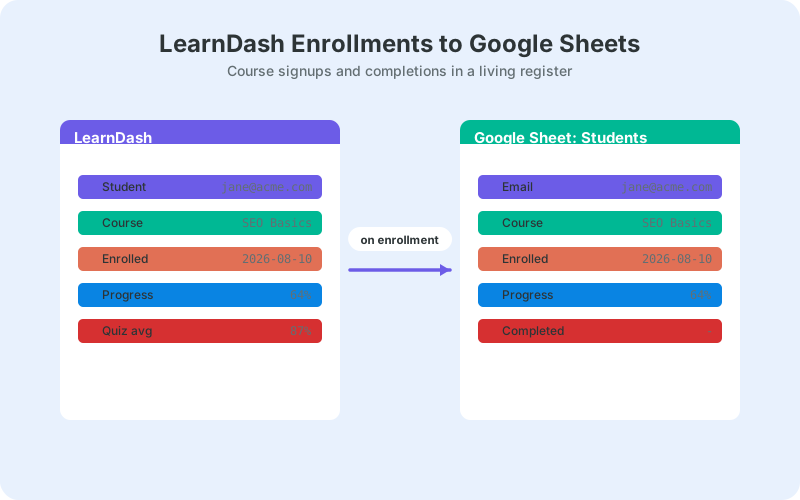
A plugin listens for LearnDash's enrollment, completion, and quiz events and appends each one as a row in your register - connected via the one-click Google connect or a classic Apps Script web app deployed in your own Google account. No Zapier, no per-event charges, and no third-party processor sitting between your LMS and your spreadsheet.
The LearnDash source is a paid add-on for the free SheetLink Forms plugin - the free core already connects 12 major form plugins to Sheets on its own. Deliveries that fail land in an automatic retry queue with exponential backoff, so a hosting hiccup during a busy enrollment day does not punch holes in your data.
Learner data deserves the same care as customer data. Either way the sheet lives in your Drive and event data travels straight from your site to Google - on the classic path the receiver script runs in your own Google account too - so there is no vendor processor sitting on learner rows. Though you should still restrict sheet sharing to people who genuinely need learner-level rows rather than aggregates.
Setting Up the LearnDash Add-On
Setup takes around ten minutes: install the free core, connect Google Sheets in the wizard (one-click Connect Google, or deploy the classic receiver script), then activate the LearnDash add-on from the add-ons page and map your columns.
- Install SheetLink Forms from WordPress.org and complete the setup wizard - use the Connect Google (one click) card and pick your register in the Google file picker, or deploy the classic Apps Script receiver in your Google account.
- Install and activate the LearnDash add-on.
- Create rules for the events you want - enrollments, completions, quiz attempts - and point them at your register.
- Map fields: event type, learner email, course, quiz, score, date.
- Enroll a test learner, finish a lesson, and take a quiz to confirm rows land correctly.
Use separate tabs per event stream so high-volume quiz data does not drown the enrollment feed, and let conditional routing direct each event type to its own tab. While testing, check the quiz row most carefully: score and attempt number are the fields most worth getting right before real learners arrive.
What Goes on an Instructor Dashboard Tab?
An instructor dashboard is a formulas-only tab that reads the raw event tabs and shows current numbers: enrollments this week, completions this month, average quiz score per course, and a short list of recent failures worth a personal check-in. It answers the questions instructors actually ask, without anyone touching raw data.
Build it with a handful of patterns: COUNTIFS against date ranges for the counters, AVERAGEIFS for quiz scores, and a QUERY for the recent-failures list. Add sparklines for week-over-week enrollment trends. The full toolkit, with working formulas, is in our Sheets dashboard guide - swap lead columns for course columns and every pattern transfers.
A concrete layout that works well as the top of the dashboard: a per-course summary block, one row per course, five named columns.
- Course - the join key against all three event tabs
- Enrollments (7d) - a COUNTIFS on the enrollments tab with a rolling date window
- Completions (30d) - the same shape pointed at the completions tab
- Quiz average - AVERAGEIFS over quiz scores for that course
- Last activity - MAX of event dates per course; a course nobody has touched in weeks is a signal in itself
Freeze the header row and the block reads like a status board at a glance, even for someone who has never opened the raw tabs.
If instructors should not see learner-level rows, keep the dashboard in a separate spreadsheet fed by IMPORTRANGE. Sharing the whole register exposes every learner's data, which you may not want for every instructor or client.
How Do You Track Cohort Completion?
Cohort completion is two COUNTIFS formulas and a division. Count learners enrolled in the cohort, count those with a completion event for the same course, and divide. Laid out as a small table by enrollment month, it becomes the single most decision-useful report a course business has.
=COUNTIFS(Enrollments!C:C, "course-a", Enrollments!E:E, "2026-09") gives cohort size; the same shape against the completions tab gives finishers. Pair them per row, add the division, and chart the rate over time.
Lay the table out with one row per cohort month and three columns: enrolled, completed, rate. Once the two COUNTIFS are in place, the rate cell is just =B2/A2 formatted as a percentage, and a SPARKLINE over the rate column shows the trend without building a chart. If a cohort's row looks alarming, click through to the raw tabs before reacting; small cohorts swing hard on a handful of learners.
Read cohort tables for inflection points, not absolute levels. Completion rates vary widely by course format and price point, but a sudden drop for one cohort points at something you changed - content, onboarding email, audience source - right around that cohort's start date.
A useful companion metric is median time to complete. With enrollment and completion dates both in the register, a MEDIAN over the date differences per cohort shows whether your pacing changes actually move learner behavior or just feel like they should.
Quiz Outcomes, Segmentation, and Follow-Up
Quiz rows are the highest-signal data in the register because they measure understanding, not just attendance. Score plus attempt number per learner supports three moves: praise, help, and content fixes - each triggered by a different pattern in the same few columns.
Segment learners directly in the sheet: passed first try, passed after retries, failing repeatedly. The mechanics mirror our guides on quiz form scoring and segmentation and auto-segmenting leads in Google Sheets - the same formulas, applied in an education context.
The failing-repeatedly segment deserves a human email within a day or two; those learners are the refund risk and the testimonial opportunity at the same time. Aggregate patterns matter just as much: when most of a cohort misses the same question, the fix is in the lesson, not the learners.
How Do the Numbers Reach Your Inbox?
A weekly digest closes the loop: a small Apps Script time trigger reads the register every Monday and emails enrollments, completions, and average quiz score for the week. Numbers that arrive get read; numbers that wait in a tab do not.
The script pattern is identical to the one in our weekly digest walkthrough - swap the lead columns for course columns and set the trigger. Send it to instructors too; a shared Monday number does more for course quality than a monthly meeting.
Keep the digest to five numbers or fewer. The moment it needs scrolling, it stops being read, and you are back to numbers waiting in a tab.
Start With Enrollments, Then Widen
Turn on enrollments first, run for a week, then add completions and quizzes once the columns look right. Each stream you add multiplies the questions the register can answer, because the interesting reports all join two streams: enrollment to completion, completion to quiz score.
Six months in, you will have a course analytics asset most LMS dashboards cannot match: your learners, your columns, your questions, in a spreadsheet you own outright. The setup cost is an afternoon; after that, the register maintains itself one row at a time.
Frequently Asked Questions
Does LearnDash have a built-in Google Sheets integration?
No live one. LearnDash offers built-in reports and CSV exports, but keeping a spreadsheet current that way means repeated manual exports. A direct add-on appends enrollments, completions, and quiz attempts as they happen, so the register stays up to date on its own.
What LearnDash data can I send to Google Sheets?
Enrollments, course completions, and quiz attempts, each with learner email, course, date, and - for quizzes - score, pass or fail, and attempt number. That event-level detail supports cohort completion rates and time-to-complete analysis that summary reports cannot reconstruct after the fact.
Can instructors see course stats without WordPress access?
Yes. Share the spreadsheet as view-only, or build a separate dashboard spreadsheet fed by IMPORTRANGE. Instructors get live enrollments, completions, and quiz averages without wp-admin accounts, and you control whether they see aggregate numbers or learner-level rows.
How do I calculate course completion rate in Google Sheets?
Divide completion events by enrollment events for the same course and period, using two COUNTIFS formulas. Group the calculation by enrollment month to get cohort completion rates, which reveal trend changes that a single overall percentage hides completely.
Do I need Zapier to connect LearnDash to Google Sheets?
No. A direct plugin route delivers each event to your sheet - one-click Google connect or a classic Apps Script receiver in your own Google account - with no middleware fees. That matters for courses because quiz attempts are high-volume, and per-task middleware pricing punishes exactly that kind of event stream.
Can I track quiz scores per learner over time?
Yes. Log each attempt as its own row with score and attempt number. Filtering by learner email shows an individual's trajectory, and an AVERAGEIFS per learner or per quiz surfaces both struggling students and questions the whole cohort keeps missing.
How do I segment learners for follow-up emails?
Add a segment column on a summary tab: passed first try, passed on retry, failing repeatedly. Each segment maps to a different follow-up - congratulations, encouragement, or a personal check-in - and an Apps Script on the sheet can drive those sends automatically.
Will logging quiz attempts slow down my site?
It should not be noticeable. Each event is one small background request, and failed deliveries queue for automatic retry instead of blocking the page. Even quiz-heavy sites generate far fewer events than page views, so the added overhead stays minimal.
More Automation guides
Send LearnDash Activity Straight to Sheets
The LearnDash add-on writes course activity to your own Google Sheet - no Zapier, no per-task fees, no data middleman.