
Easy Digital Downloads to Google Sheets: Sales Tracker
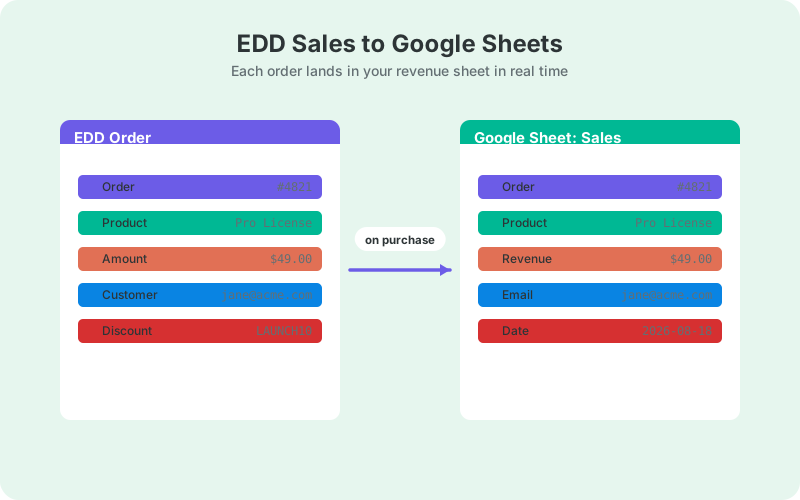
Every order lands as a spreadsheet row: order ID, product, amount, discount code, customer. Then QUERY, pivot tables, and a clean refund pattern turn that raw feed into real revenue reporting.
In This Guide
- Every EDD Order, One Spreadsheet Row
- Why Track EDD Sales in a Spreadsheet?
- What Columns Does an EDD Revenue Sheet Need?
- How Does the Direct Connection Work?
- Setting Up the EDD Add-On
- How Do You Report EDD Revenue With QUERY?
- Where Do Pivot Tables Fit In?
- How Should You Track Refunds in Google Sheets?
- From Revenue Sheet to Live Dashboard
- Your Next Step
- Frequently Asked Questions
Every EDD Order, One Spreadsheet Row
You can log every Easy Digital Downloads sale to a Google Sheet automatically: order ID, product, amount, discount code, and customer email arrive as a new row seconds after checkout completes. Easy Digital Downloads runs on 40,000+ active stores (WordPress.org, 2026), but its built-in reports only answer the questions its developers anticipated. A spreadsheet answers yours.
This tutorial builds a complete revenue register for a digital products store. We will cover the column layout that makes reporting painless, the direct connection that writes rows without Zapier, QUERY formulas and pivot tables for revenue analysis, and a refund pattern that keeps your totals honest. If you sell physical goods too, the same approach carries over - see the WooCommerce Google Sheets integration guide for that side of the store.
Why Track EDD Sales in a Spreadsheet?
Because spreadsheets are still where real financial analysis happens. Between 47% and 64% of companies use stand-alone spreadsheets for planning and budgeting (EBSCO, 2025), and digital stores are no exception. EDD's dashboard shows you what happened. A sheet lets you ask why, slice by any column, and share the answer with anyone.
Three jobs get dramatically easier once orders live in a sheet. First, ad-hoc questions: revenue by discount code, repeat purchase rate, refund rate per product. Second, accountant access: share one tab instead of creating a wp-admin login. Third, longevity: your sales history survives plugin changes, redesigns, and even a platform migration, because it lives in a file you own.
There is also a speed argument. When the row appears seconds after checkout, the sheet doubles as a live order feed. You can watch a launch day unfold in real time, spot a broken discount code within minutes, and answer a customer question without opening wp-admin at all.
What Columns Does an EDD Revenue Sheet Need?
Eleven columns cover almost every report you will ever build. Start wider than you think you need: deleting a column later is trivial, but recovering data you never captured is impossible. Keep one row per order for simple stores, or one row per line item if customers regularly buy several products at once.
- Order ID - the join key for refunds and support lookups
- Date - full timestamp, not just the day
- Product(s) - names, comma-separated if you log per order
- Gross amount - before discounts
- Discount code - blank when none was used
- Discount amount - what the code cost you
- Net amount - what you actually collected
- Customer email - powers repeat-buyer analysis
- Country - useful for tax and pricing decisions
- Payment gateway - Stripe vs PayPal reconciliation
- Status - completed, pending, or refunded
The Status column matters more than it looks. Every formula in the sections below filters on it, it is what makes the refund pattern work, and it is the first thing an accountant will ask about when reconciling your gateway payouts against the sheet.
How Does the Direct Connection Work?
The plugin listens for EDD's order-completion event and appends the row to your sheet directly. Connect with the one-click Google Sheets connect (v1.12.0): click Connect Google, then pick or create the revenue sheet in the Google file picker. Or use the classic Apps Script web app deployed in your own Google account. No Zapier, no per-task fees, and no per-submission middleman ever touches your sales data on its way to the sheet. Your store keeps working exactly as before; the integration only listens.
The classic route remains fully supported: Apps Script is Google's own automation platform, and it became a Google Workspace core service with enterprise-grade data protection in June 2026 (Google, 2026). In practice that means either receiving end of this pipeline is infrastructure Google supports directly, not a hobby workaround.
Delivery is also fault-tolerant. Webhook-style requests do occasionally fail in the real world - hosts time out, quotas hiccup - so SheetLink Forms queues any failed delivery and retries automatically with exponential backoff, and you can trigger a manual retry from the delivery log. For a revenue record, that reliability difference is the whole point.
Setting Up the EDD Add-On
Setup takes about ten minutes and no code - the Google connection itself is a one-click connect, with a classic paste-a-script route if you prefer fully self-hosted. The free SheetLink Forms core handles 12 major form plugins out of the box; Easy Digital Downloads support comes from a paid add-on available on the add-ons page.
- Install the free SheetLink Forms plugin from WordPress.org and run the setup wizard: click Connect Google and pick or create your revenue sheet in the Google file picker, or deploy the classic Apps Script receiver in your Google account.
- Install and activate the Easy Digital Downloads add-on.
- Create a rule that targets EDD orders and point it at your revenue sheet tab.
- Map order fields to the columns from the previous section.
- Run a test purchase with a 100% discount code and confirm the row appears.
That last step doubles as your first data check: you should see the discount code and a zero net amount in the correct columns. If a column lands empty or shifted, fix the field map before real orders arrive - a five-minute correction now saves an hour of column surgery later.
How Do You Report EDD Revenue With QUERY?
QUERY is the fastest route from raw order rows to a real report. One formula gives you revenue by product, by discount code, or by gateway, and it updates itself every time a new order lands. If you have never used it, our QUERY function guide covers the syntax in depth on WordPress data.
Revenue by product, completed orders only, sorted by revenue:
=QUERY(Orders!A:K, "select C, count(A), sum(G) where K = 'completed' group by C order by sum(G) desc", 1)
Discount code performance - how many orders each code drove, what it cost you, and what it collected:
=QUERY(Orders!A:K, "select E, count(A), sum(F), sum(G) where E is not null and K = 'completed' group by E", 1)
Put these on a separate Reports tab, never on the raw data tab. The raw tab stays append-only; the Reports tab is where formulas, formatting, and opinions live. A monthly revenue line is just as short: group by a month helper column, sum the net amount, and you have the number your profit and loss statement wants.
Where Do Pivot Tables Fit In?
Pivot tables answer the question every store owner asks monthly: which products earned what, and is the trend up or down? Select your data range, choose Insert, then Pivot table, and Google Sheets builds the cross-tab for you - no formulas required and nothing to maintain by hand.
Set Rows to the product column, Columns to a month helper column (=TEXT(B2, "YYYY-MM") in a spare column works well), and Values to SUM of net amount. Filter Status to completed. You now have a product-by-month revenue matrix that refreshes as orders arrive.
Two practical tips: build the pivot on whole-column ranges so new rows are picked up automatically, and duplicate the pivot tab before experimenting - pivots are easy to break and annoying to rebuild from memory.
From there it is a short step to charts and sparklines that make trends readable at a glance. The Sheets dashboard guide shows those patterns applied to WordPress data, and every one of them transfers directly to this revenue sheet.
How Should You Track Refunds in Google Sheets?
Record refunds as new rows with a refunded status and a negative net amount. Your SUM-based reports then stay truthful automatically: a $49 sale followed by a $49 refund nets to zero without any manual cleanup, and you keep a visible audit trail of both events.
The alternative is update-in-place: an upsert keyed on Order ID flips the original row's status to refunded when the refund happens. This keeps the sheet compact but erases the timeline. For a revenue register, the append-only pattern is usually the better default, because accountants prefer records that never change after they are written.
Either way, refund rate becomes a one-liner: =COUNTIF(K2:K, "refunded") / COUNTA(A2:A). Run it per product with COUNTIFS and you will quickly learn which product generates support pain rather than profit. Watch the trend, not just the level: a rising refund rate on one product usually means its landing page is overpromising.
From Revenue Sheet to Live Dashboard
Once the register is flowing, the sheet becomes a data source, not just a destination. Google's free Looker Studio connects to it in a couple of clicks and turns the same rows into scorecards, time series, and filterable tables you can share with a partner, a client, or an investor.
The Looker Studio walkthrough builds one of these dashboards step by step on top of a WordPress-fed sheet. Swap in your revenue columns and the same recipe gives you a store dashboard that updates itself every time a sale lands.
Keep the connection one-way: Looker Studio reads the sheet, the store writes it. That separation means an experiment in the dashboard can never corrupt the underlying revenue record.
Your Next Step
Start with the eleven columns, connect the order feed, and let it run for a week before building reports - real data exposes mapping mistakes faster than any test order will. Then add the QUERY tab, the pivot, and the refund formula, in that order.
The result is a revenue record you own outright, in a format every accountant, co-founder, and future version of you already knows how to read. Set up the feed today, make one discounted test purchase, and watch the first row land.
Frequently Asked Questions
Does Easy Digital Downloads have a built-in Google Sheets export?
No live one. EDD can export orders to CSV manually, which you can then import into Sheets, but that is a snapshot you must keep repeating. A direct integration appends each order as it happens, so the sheet is always current without anyone remembering to export.
Do I need Zapier to send EDD orders to Google Sheets?
No. A direct plugin connection writes each order straight to your sheet - one-click Google connect or a classic Apps Script receiver in your own Google account - so there is no middleware subscription and no per-task fees. Zapier works too, but every single order consumes a billable task there, which gets expensive for busy stores.
What EDD order fields can I send to my sheet?
The essentials are order ID, date, products, gross and net amounts, discount code, customer email, payment gateway, and status. Capture more than you think you need - country and gateway columns look optional until tax season, when they suddenly become the most important columns you have.
How do I track EDD refunds in Google Sheets?
Append a second row with a refunded status and a negative amount. SUM-based reports then correct themselves automatically, and you keep an audit trail of both the sale and the refund. From there, your overall refund rate is one COUNTIF formula away.
Can I sync past EDD orders, or only new ones?
The live connection covers new orders from the moment you enable it. For history, use EDD's built-in CSV export, paste the rows above your live data with matching columns, and your QUERY and pivot reports will treat old and new orders identically.
Can my accountant use the sheet without a WordPress login?
Yes, and that is one of the main reasons to build it. Share the spreadsheet, or just the Reports tab, with view access. Your accountant gets order-level detail and monthly totals without ever touching wp-admin, and you control exactly what they can see.
How do I report EDD revenue by month in Google Sheets?
Add a month helper column with =TEXT(B2, "YYYY-MM"), then either build a pivot table with months as columns or use QUERY to group by that column and sum net revenue. Both approaches update themselves automatically as new orders arrive in the sheet.
Can I track discount code performance in Google Sheets?
Yes. With code and discount-amount columns in place, one QUERY shows orders driven, revenue collected, and margin given away per code. That turns coupon decisions from guesswork into arithmetic, and it is exactly the report EDD's own dashboard is weakest at.
More Tutorial guides
Put Every EDD Sale in a Google Sheet Today
The EDD add-on writes orders, discounts, and refunds straight to your own sheet - no Zapier tasks, no per-order fees.